
By far, this marks the city’s largest commitment to date to replace the dwindling pandemic aid.
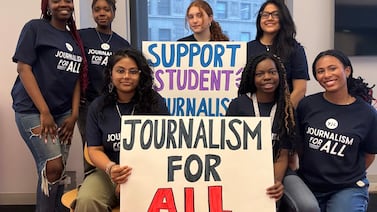
Almost 75% of the city’s high schools do not have student publications, according to a 2022 study.
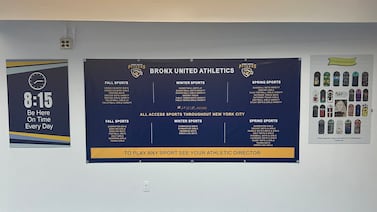
Black and Hispanic students have historically had far less access to sports. The situation has led one school’s dean to file a federal civil rights complaint.
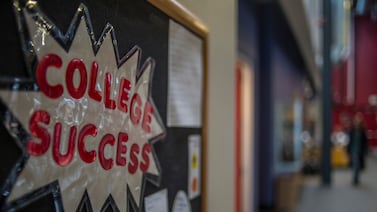
Studies show students who complete federal financial aid applications are far more likely to attend college.

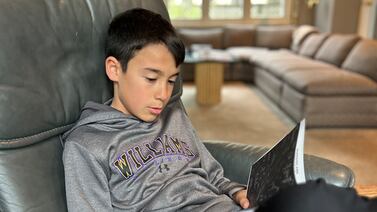
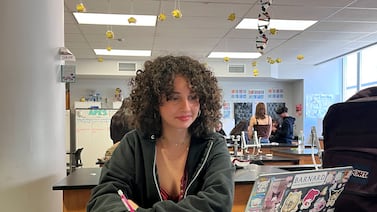
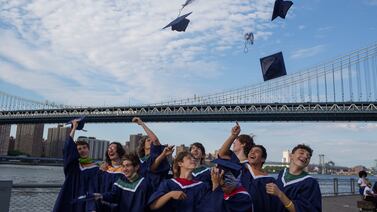
One is participating in an intensive apprenticeship program at Bloomberg and the other dashed off 23 college applications.
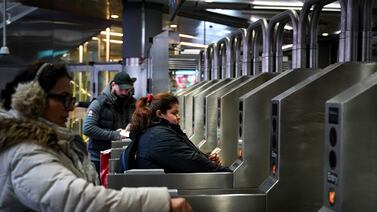
Schools are supposed to give parents of students in temporary housing free MetroCards each month. But problems with distributing them are leading to absences and fare evasion tickets.
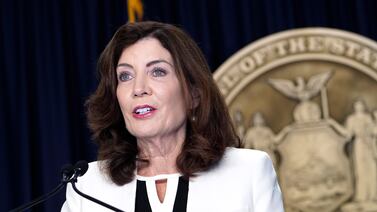
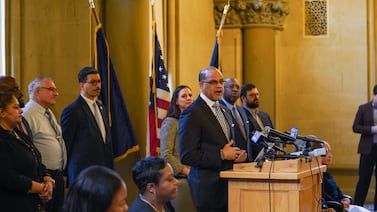
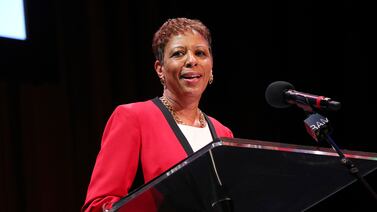
“There’s still time to see if we can get this worked out,” Gov. Kathy Hochul said of her push to include New York City’s mayoral control governance system in the budget.
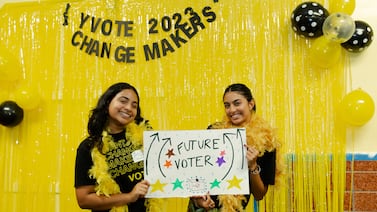
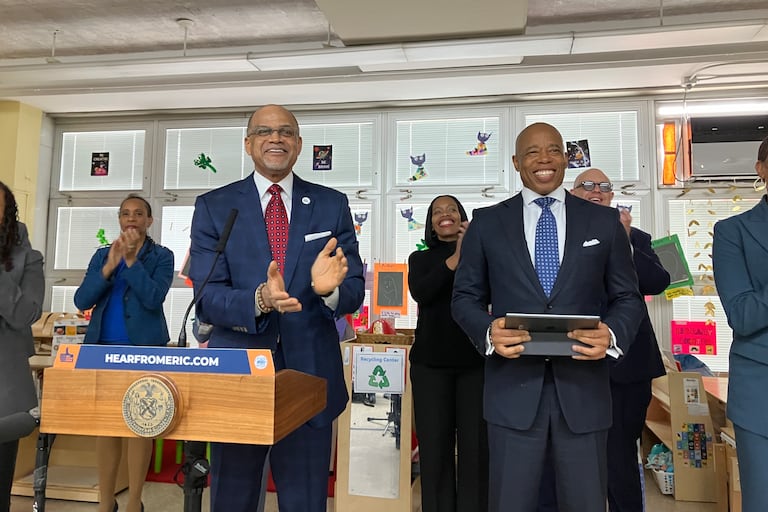
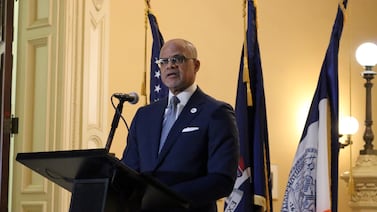
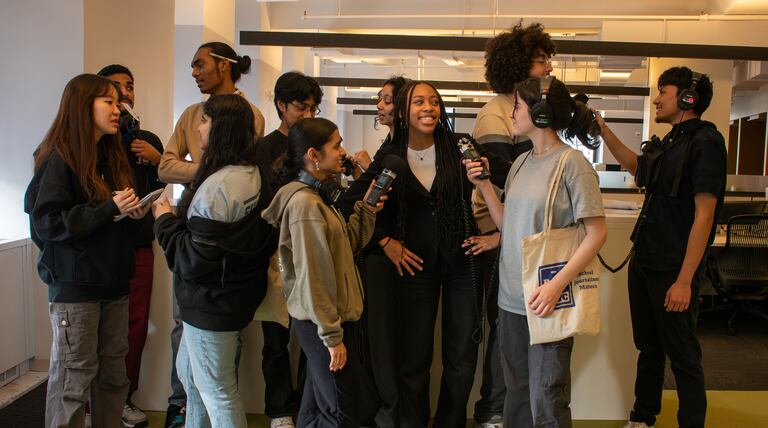
The ‘Youth Civic Hub,’ an online portal launched on Friday aims to increase youth civic engagement and electoral participation.
Deputy Chancellor Dan Weisberg made the comments after a Brooklyn superintendent suggested his district, which includes affluent neighborhoods, would have flexibility with the curriculum mandate.
The city school system, like districts across the country, has dealt with a surge in tensions following Hamas’s Oct. 7 attack on Israel, and Israel’s subsequent bombardment of the Gaza strip.
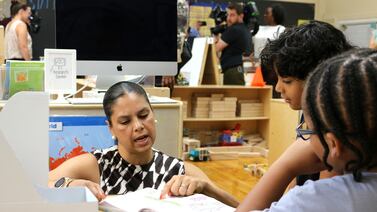
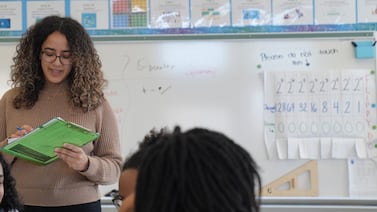
The literacy overhaul has enjoyed support from many advocates and experts. But will the momentum last as NYC expands its reading instruction shift?
This episode of P.S. Weekly focuses on New York City’s complex special education system and challenges students face getting accommodations like extra time on exams.
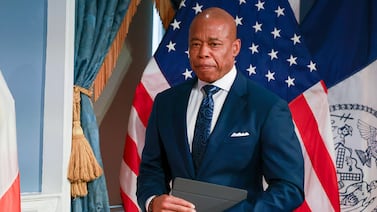
One state lawmaker said the report would be “invaluable” in deliberations over whether and how to extend mayoral control.
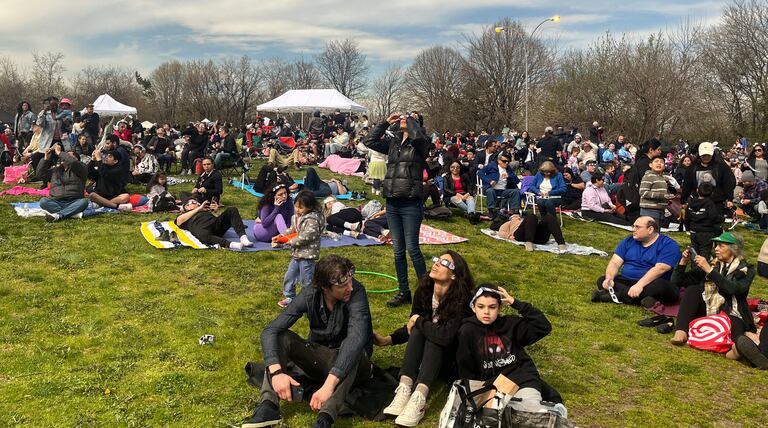
Some parents pulled their kids out of school as the exceedingly rare phenomenon appeared in New York City’s skies on Monday.
Many schools across the city sent messages to families Friday morning, assuring them that students remained safe.
The schools offer a mix of elementary, middle, and high school programs across three boroughs.
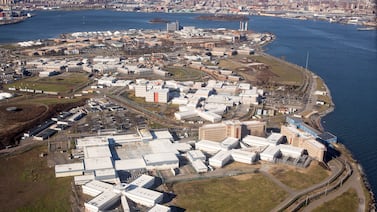
Young adults at Rikers are entitled to attend the Education Department’s East River Academy and work towards a high school diploma or GED.
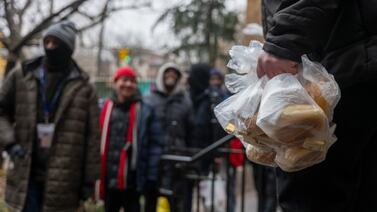
The staffers play a critical role on the front lines of two colliding crises: the exploding number of students living in homeless shelters, and elevated rates of chronic absenteeism in the wake of the pandemic.
For many, the Wednesday placements marked the end of the city’s middle school admissions process.
Become a Chalkbeat sponsor

This episode of P.S. Weekly looks at how a recent national wave of book banning has touched NYC schools. One Queens librarian faced harassment for posting LGBTQ books on social media.
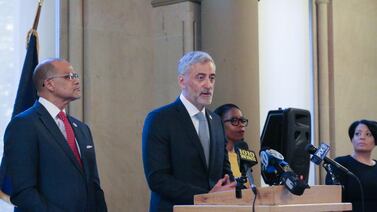
It’s the second time in recent months that schools Chancellor Banks has made the case in Albany for extending mayoral control
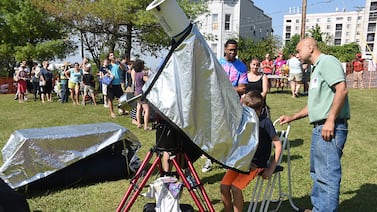
El 8 de abril habrá un eclipse solar total en parte del estado de Nueva York, y se espera que el fenómeno sea parcialmente visible en la ciudad.
Early childhood education programs have seen steep cuts in recent months.

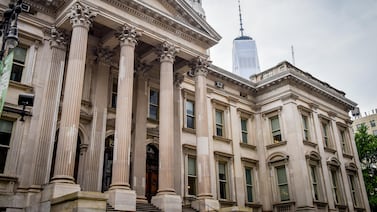
The lawsuit, filed in response to pandemic disruptions to student services, has repeatedly faced legal setbacks. But it might finally move forward following a judge’s decision.
Join us on April 17 for a virtual event to hear more about the production team behind the P.S. Weekly podcast and how you can potentially get your voice on the show.
Despite ‘less intrusive’ metal detectors, NYC schools will still require X-ray scanning of backpacks
Education Department officials aren’t planning to take advantage of the device’s major selling point: allowing students to walk through without removing their backpacks.
The program’s popularity likely means thousands of families won’t get a seat.
New York has been “a rather hostile political environment” for charter schools, Success CEO Eva Moskowitz said Wednesday.
Brooklyn state Sen. Zellnor Myrie recently introduced legislation for the state’s Office of Children and Family Services to conduct a feasibility study for universal after-school.
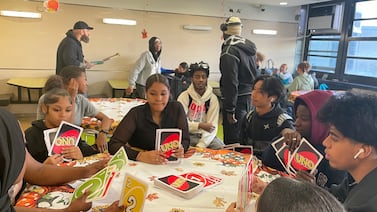
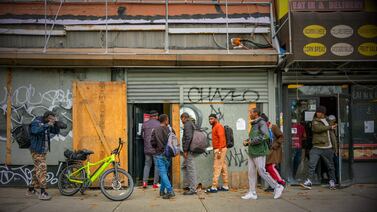
P.S. Weekly talks with students and educators about the challenges migrant students are facing.
The next total solar eclipse in the state will not occur until 2079.
NYC schools disband division of teaching and learning, which oversees Banks’ top literacy initiative
Carolyne Quintana, a deputy chancellor who oversees the department’s signature literacy initiative, is leaving at the end of the school year.

This year, fifth and eighth grade students will shift to computer-based state exams. Some educators worry the move will affect performance.
The data comes as state education officials are engaged in a multi-year effort to rethink high school graduation requirements.
Mayor Eric Adams is cutting nearly $7 million from NYC’s after-school program, scrapping about 3,500 seats at a time when interest in programs is on the rise.
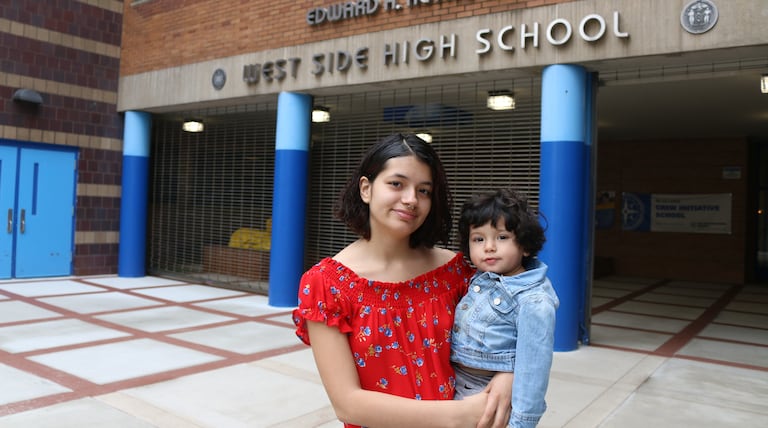
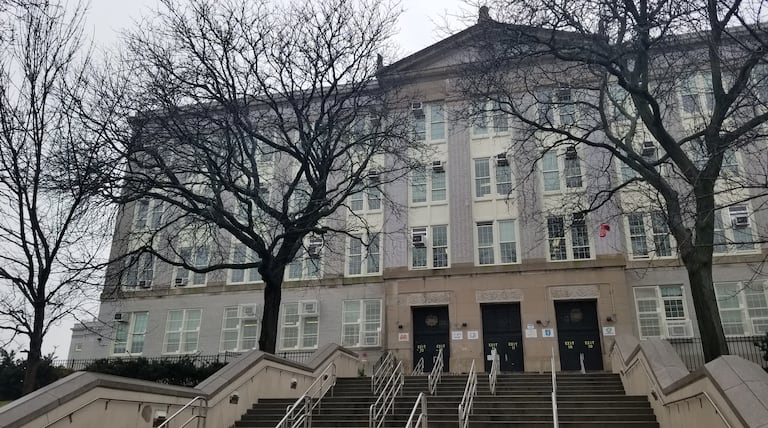
Seven Edward A. Reynolds West Side High School teachers and a student who spoke to Chalkbeat said the move to the new space has worsened their school experience in almost every way.
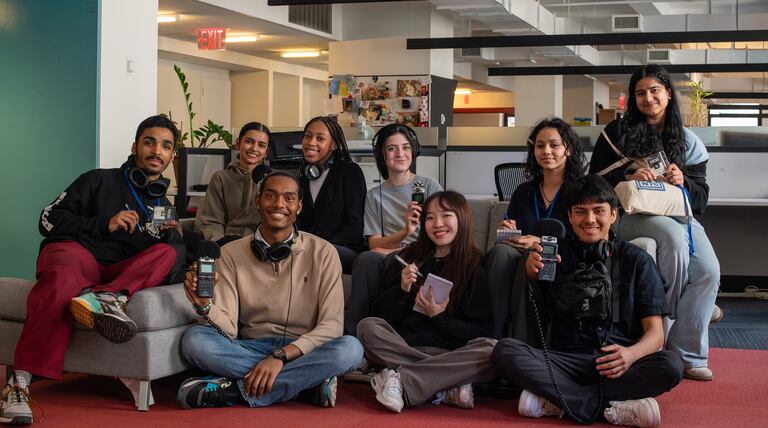
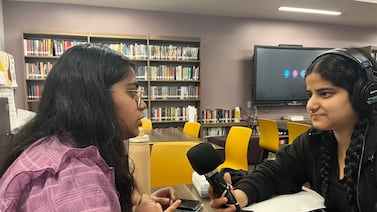
Listen to the sounds of the NYC school system. From Chalkbeat and The Bell, this student-created podcast explores pressing issues facing schools. Episodes will air Wednesday mornings.
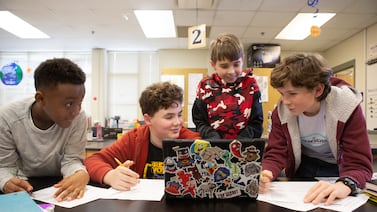
Maha Hasen has made it her mission to bring computer science to Fordham High School for the Arts and reach more girls.
Federal law that protects the educational rights of homeless children and youth under 21 says young adults should be enrolled in school immediately, but the city is not meeting this requirement, advocates say.