
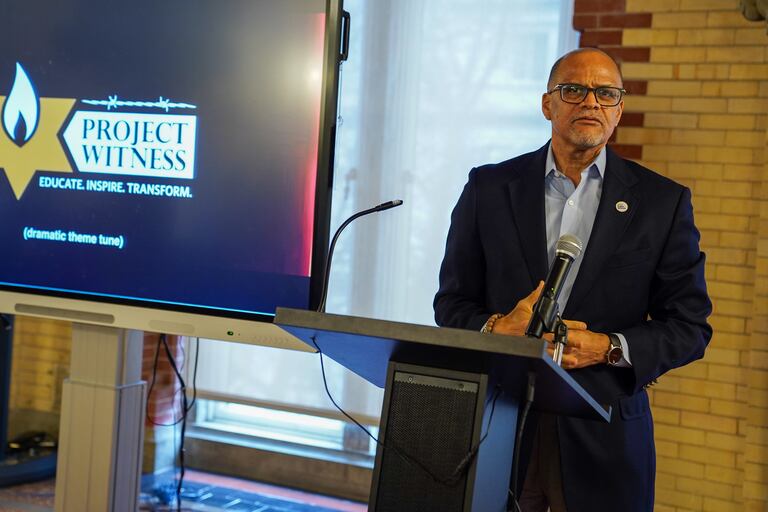
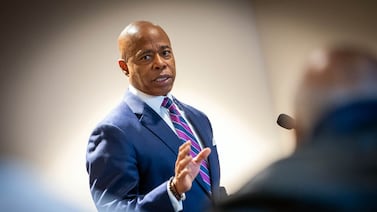
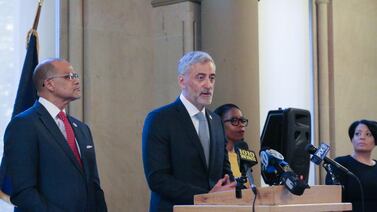
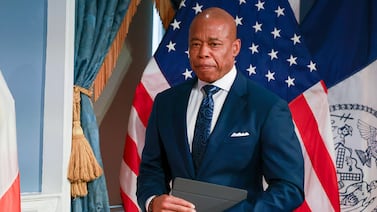
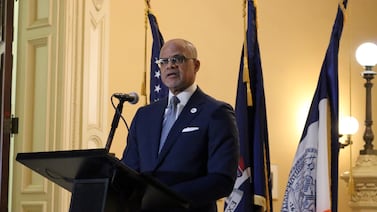
Chancellor David Banks is set to testify at a congressional hearing on antisemitism in K-12 schools, facing the committee that recently grilled the presidents of elite colleges.
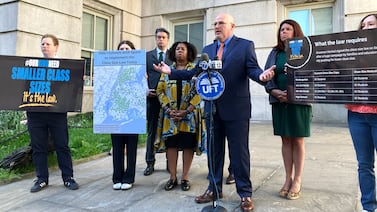
New York City’s teachers union is ratcheting up the pressure on the Education Department to comply with the state class size law.
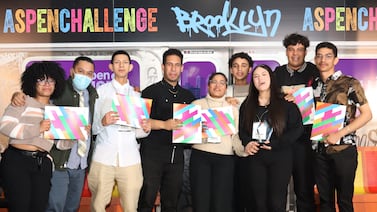
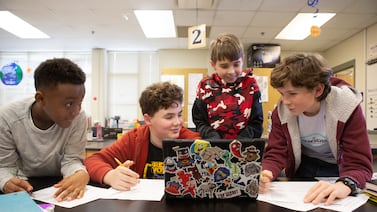
Students presented their ideas for dealing with the teen mental health crisis, bias toward immigrants, and rats at a youth version of the famous Aspen Ideas Festival.
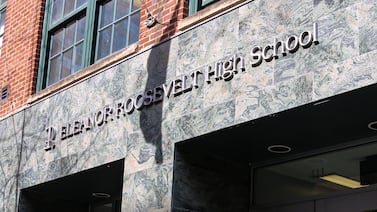
The announcement set off alarm bells for school integration advocates, who worry it could roll back progress diversifying several high-demand schools.
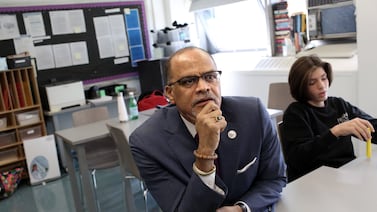
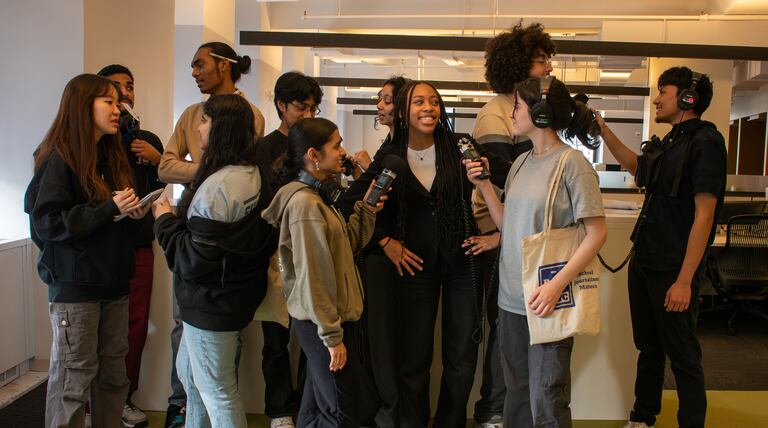
Banks previews the message he plans to take to Congress for a hearing on responses to antisemitism in school.
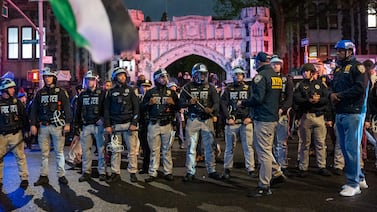
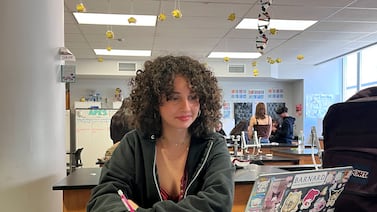
As NYC students figure out college plans, many are scrutinizing how administrators respond to campus activism.
Mayor Eric Adams and top police officials continued to claim, with little evidence, that “outside agitators” were behind the encampments.
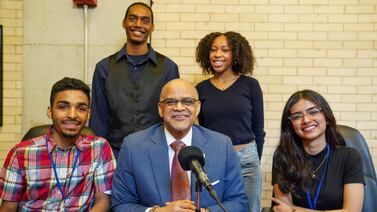
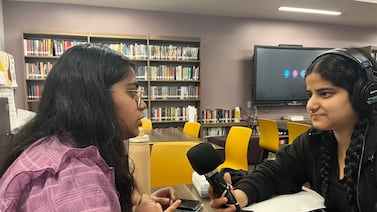
Listen as student reporters speak with Banks about New York City’s Hidden Voices curriculums, school integration efforts, and more.
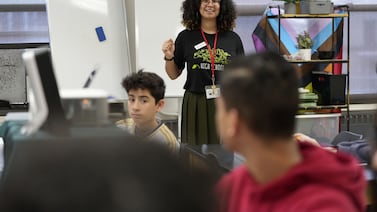
A trip to the Arctic inspired Brooklyn Prospect High School’s Caitlyn Homol to create a unit exploring “the relationship between motivation, action, and climate attitudes.”
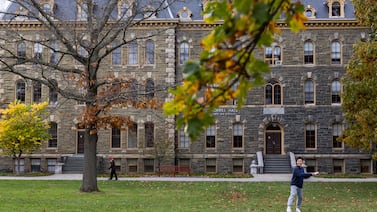
“It's a fundamentally wrong and unfair practice,” one student said, calling it “affirmative action for the wealthy.”
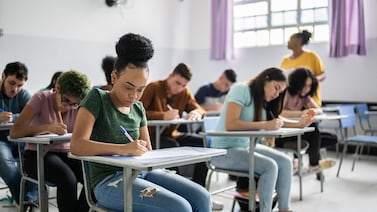
About 8% of New York City students opted out of the state’s reading test last year, roughly double the pre-pandemic rate.
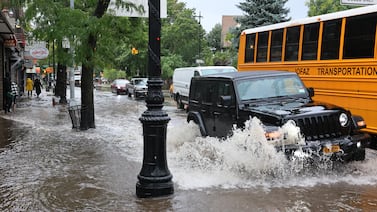
More school buildings were impacted by Tropical Storm Ophelia than previously known — and the city comptroller faulted the city’s communication during the storm.
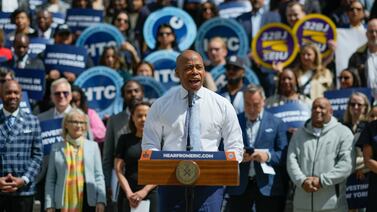
The smaller budget is largely the result of expiring federal relief dollars, and Adams’ proposal saves a slew of programs that were on the chopping block.
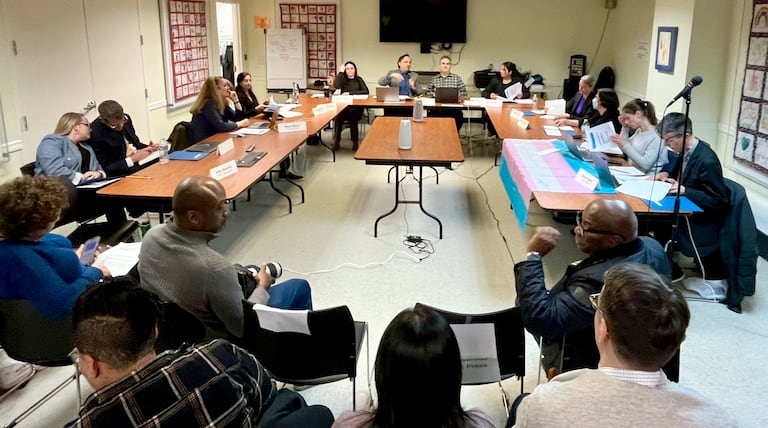
A Manhattan parent board’s nonbinding resolution to revisit school guidelines on transgender girls' participation in sports raised alarms among trans students and their allies.
“This decision making was clearly rushed,” one lawmaker said. “It's not best practice, but this is where we are.”
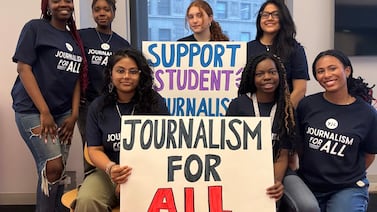
Almost 75% of the city’s high schools do not have student publications, according to a 2022 study.
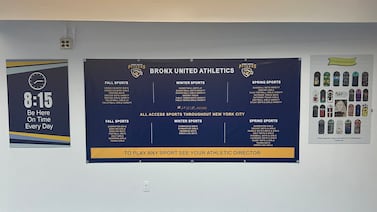
Black and Hispanic students have historically had far less access to sports. The situation has led one school’s dean to file a federal civil rights complaint.
Studies show students who complete federal financial aid applications are far more likely to attend college.

One is participating in an intensive apprenticeship program at Bloomberg and the other dashed off 23 college applications.
Become a Chalkbeat sponsor

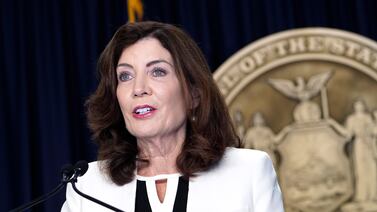
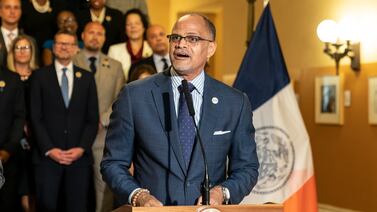
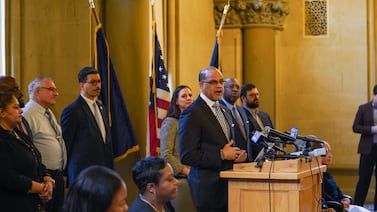
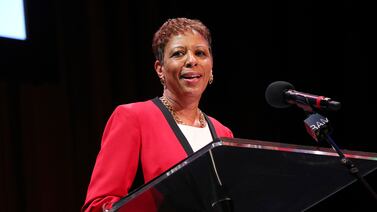
“There’s still time to see if we can get this worked out,” Gov. Kathy Hochul said of her push to include New York City’s mayoral control governance system in the budget.
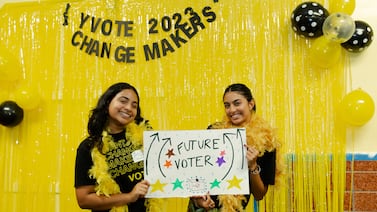
The ‘Youth Civic Hub,’ an online portal launched on Friday aims to increase youth civic engagement and electoral participation.
Deputy Chancellor Dan Weisberg made the comments after a Brooklyn superintendent suggested his district, which includes affluent neighborhoods, would have flexibility with the curriculum mandate.
The city school system, like districts across the country, has dealt with a surge in tensions following Hamas’s Oct. 7 attack on Israel, and Israel’s subsequent bombardment of the Gaza strip.
The literacy overhaul has enjoyed support from many advocates and experts. But will the momentum last as NYC expands its reading instruction shift?
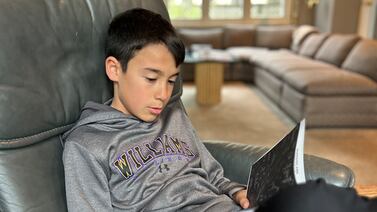
This episode of P.S. Weekly focuses on New York City’s complex special education system and challenges students face getting accommodations like extra time on exams.
One state lawmaker said the report would be “invaluable” in deliberations over whether and how to extend mayoral control.
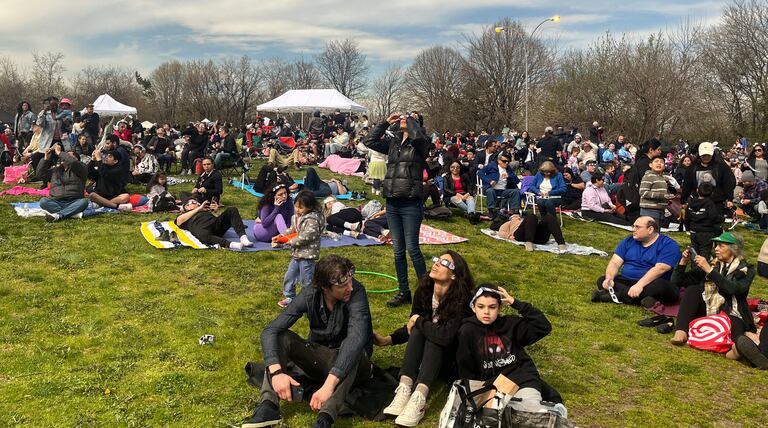
Some parents pulled their kids out of school as the exceedingly rare phenomenon appeared in New York City’s skies on Monday.
Many schools across the city sent messages to families Friday morning, assuring them that students remained safe.
The schools offer a mix of elementary, middle, and high school programs across three boroughs.
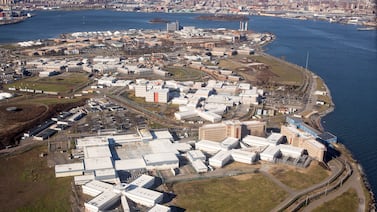
Young adults at Rikers are entitled to attend the Education Department’s East River Academy and work towards a high school diploma or GED.
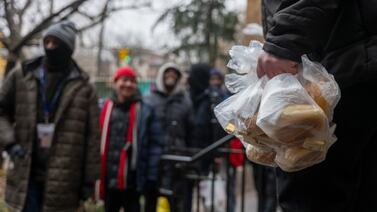
The staffers play a critical role on the front lines of two colliding crises: the exploding number of students living in homeless shelters, and elevated rates of chronic absenteeism in the wake of the pandemic.
For many, the Wednesday placements marked the end of the city’s middle school admissions process.
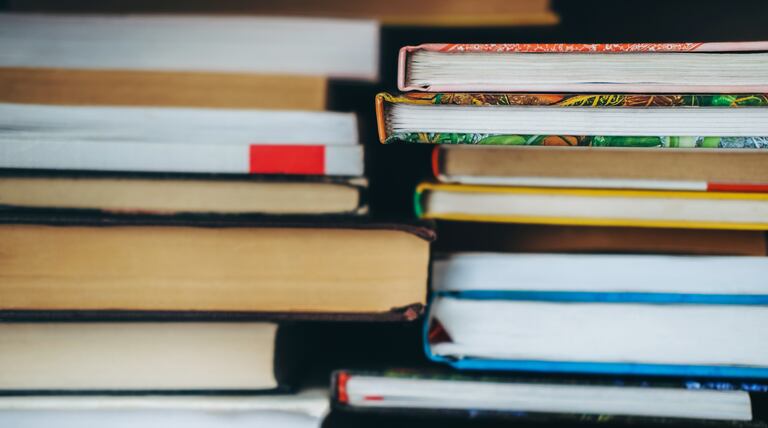
At Academy of American Studies in Queens, an English class teaches students about books that have historically faced challenges or bans.
This episode of P.S. Weekly looks at how a recent national wave of book banning has touched NYC schools. One Queens librarian faced harassment for posting LGBTQ books on social media.
It’s the second time in recent months that schools Chancellor Banks has made the case in Albany for extending mayoral control
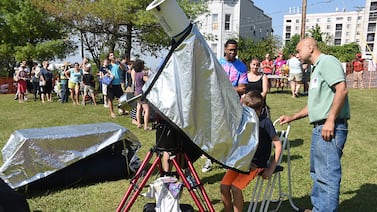
El 8 de abril habrá un eclipse solar total en parte del estado de Nueva York, y se espera que el fenómeno sea parcialmente visible en la ciudad.
Early childhood education programs have seen steep cuts in recent months.

The lawsuit, filed in response to pandemic disruptions to student services, has repeatedly faced legal setbacks. But it might finally move forward following a judge’s decision.
Join us on April 17 for a virtual event to hear more about the production team behind the P.S. Weekly podcast and how you can potentially get your voice on the show.